
The happiest countries and findings from the World Happiness Report 2026
Finland, Iceland, Denmark lead the 2026 ranking. Full list of 147 countries, key findings on social media and wellbeing, and how your donations create happiness.


The WHR 2025 contained a groundbreaking chapter: the first systematic attempt to measure charity effectiveness in units of happiness. The result: the gap between the best and the rest is staggering.
The research
The chapter brought together 24 cost-effectiveness estimates produced by four independent evaluators — all based in the UK, the world leader in wellbeing research.

The unit of measurement
1 WELLBY = an increase of 1 point on the 0–10 scale of the World Happiness Report for one person for one year. This unit makes it possible to compare very different interventions on a common basis.

-0.5
Wellbeing points lost after one year of unemployment
+0.3
Wellbeing points gained from getting married
+0.2
Wellbeing points gained from doubling your income
The impact gap
If your height represented the effectiveness of the least impactful charity on the list (which still has a positive effect), the best charity would tower five times higher than the Eiffel Tower. The top charities are hundreds of times more effective — at no extra cost to you.

Pure Earth
Lead exposure reduction
Awareness and interventions to reduce lead poisoning in low-income countries, improving health and cognitive outcomes.

Taimaka
Treating malnutrition
Distribution of therapeutic foods to treat acute malnutrition in Nigeria.


StrongMinds and Friendship Bench
Mental health — Sub-Saharan Africa
These two organisations provide affordable, scalable mental health support in sub-Saharan Africa, where needs are enormous and care is almost unavailable. To put it in perspective: $20 is what many people spend on a restaurant meal. That same amount directed to the best charity can increase someone's happiness by one point for an entire year — more than the difference between having a job and being unemployed.
Mieux Donner recommendation
The Happier Lives Institute also evaluated AMF, which is not featured in the report. Its impact on wellbeing is significant, primarily through deaths avoided and suffering reduced by malaria prevention. AMF is one of Mieux Donner's top recommendations for health and poverty. Give today and make a measurable difference.
Support effective charitiesMost people assume the best charity is about 1.5 times more effective than a typical one. The reality documented by the WHR 2025 is radically different.
Common intuition
×1.5
What most people estimate as the gap between the best and an average charity
Top 5 vs UK average
×150
The top five charities are ~150 times more effective than the UK average. £1,000 = £150,000 in equivalent impact.
Best vs most popular
×3,500
Pure Earth is ~3,500 times more effective than guide dogs or homelessness housing interventions, yet those remain popular giving destinations.

Before the WHR 2025, there was no standardised method for comparing charities on what truly matters: the wellbeing they create. This new data changes everything. The gap between the best and other charities is far larger than most people believe, as we also document across domains on our recommendations page.

Should I give?
You may not be required to, but you should if you can. And if you decide to give, most people intuitively feel it's better to make a big difference than a small one.
Will giving make me happier?
Yes. The first chapter of the WHR 2025 finds that people who donate benefit more than those who perform other kind acts, such as helping strangers or volunteering. If you're not convinced, you can always try.
Is it wrong to switch charities to help more?
No, not if the goal is to help others more. If it makes it easier for you, consider giving to both the most effective charities and the ones closest to your heart.
How much should I give?
The highest amount you can sustain over time.
At Mieux Donner, we promote the 10% Pledge: giving 10% of your income to high-impact charities. If that's not yet possible, 1% is a great starting point — or try a test commitment of 1% for a limited period.
10% Pledge 🔸
Join the people who have chosen to direct a share of their income to the most effective organisations. Even 1% is a meaningful first step.
Take the pledgeThe world can feel full of problems beyond our reach. But it turns out we can act with confidence that we are making a difference: we can now measure the impact of charities on happiness, and that impact varies so dramatically between organisations that choosing the best ones multiplies our contribution at no extra cost.
Even as governments step back from certain causes, we can — collectively and across borders — keep contributing to improving the lives of the most vulnerable. Giving to excellent charities does a great deal of good in itself. It also sends a signal that many of us feel a responsibility to turn our values into action and make the world a better place.
Source: World Happiness Report 2025, chapter on wellbeing and charity effectiveness, Michael Plant, Happier Lives Institute.
Finland, Iceland, Denmark lead the 2026 ranking. Full list of 147 countries, key findings on social media and wellbeing, and how your donations create happiness.

Human life is precious. It is natural to want to mobilise all our resources to save a life, even if it only prolongs a life by a week. But what happens when other people are also in danger, and our resources are not enough to help them all? As a society, we face practical limits that force us to make difficult decisions.

It’s easy to feel discouraged by the dramatic retreat of glaciers in the Alps and the scale of climate change can easily leave us feeling powerless. This article will equip you with the knowledge to take meaningful climate action, in both your personal life and through your charitable donations.
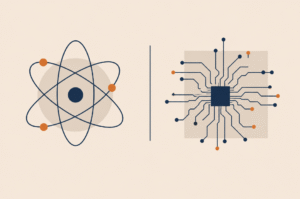
€8,920 collected through Mieux Donner, €746,000 in total with Effektiv Spenden: here is how the Safeguarding the Future Fund allocated its H2 2025 donations across three projects in nuclear security and AI safety.
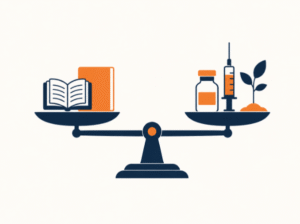
The Smart Buys Alliance brings together government agencies, research centres and philanthropic organisations to produce and disseminate lists of the most cost-effective development interventions. An overview of the initiative, its methodology and its key areas of focus.
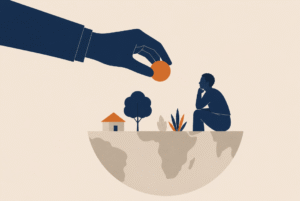
Is deciding from London or Paris who needs help and how a form of colonialism? This article examines what the critique gets right, where it goes wrong, and what effective giving does concretely differently — including its own blind spots.